Mesozoic Climate
A 186-million-year greenhouse,
with dinosaurs in Antarctica
From the Triassic to the end of the Cretaceous, Earth ran almost without interruption in a greenhouse regime: high carbon dioxide, no polar ice caps, and warm oceans. This page reconstructs that history based on five recent paleoclimatology studies.
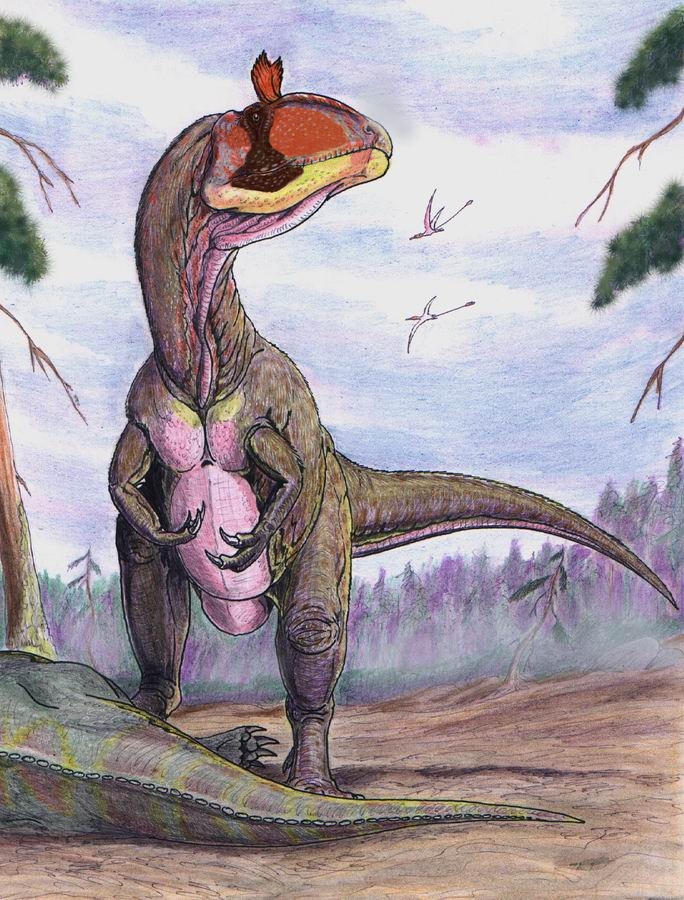
In 1991, researchers found in Antarctica the bones of a carnivorous dinosaur with a curious bony crest on its skull. They named the creature Cryolophosaurus elliotti. It was about six meters long, lived 190 million years ago, and inhabited a region today covered in ice year-round.
The reason ties to the climate of the entire Mesozoic. The planet was radically warmer than today, there was no permanent ice cap, and plants grew near the poles. But this climate was not uniform either: it changed across the three Mesozoic periods as Pangaea broke up, sea levels rose, volcanic provinces erupted, and the concentration of carbon dioxide (CO2) oscillated.
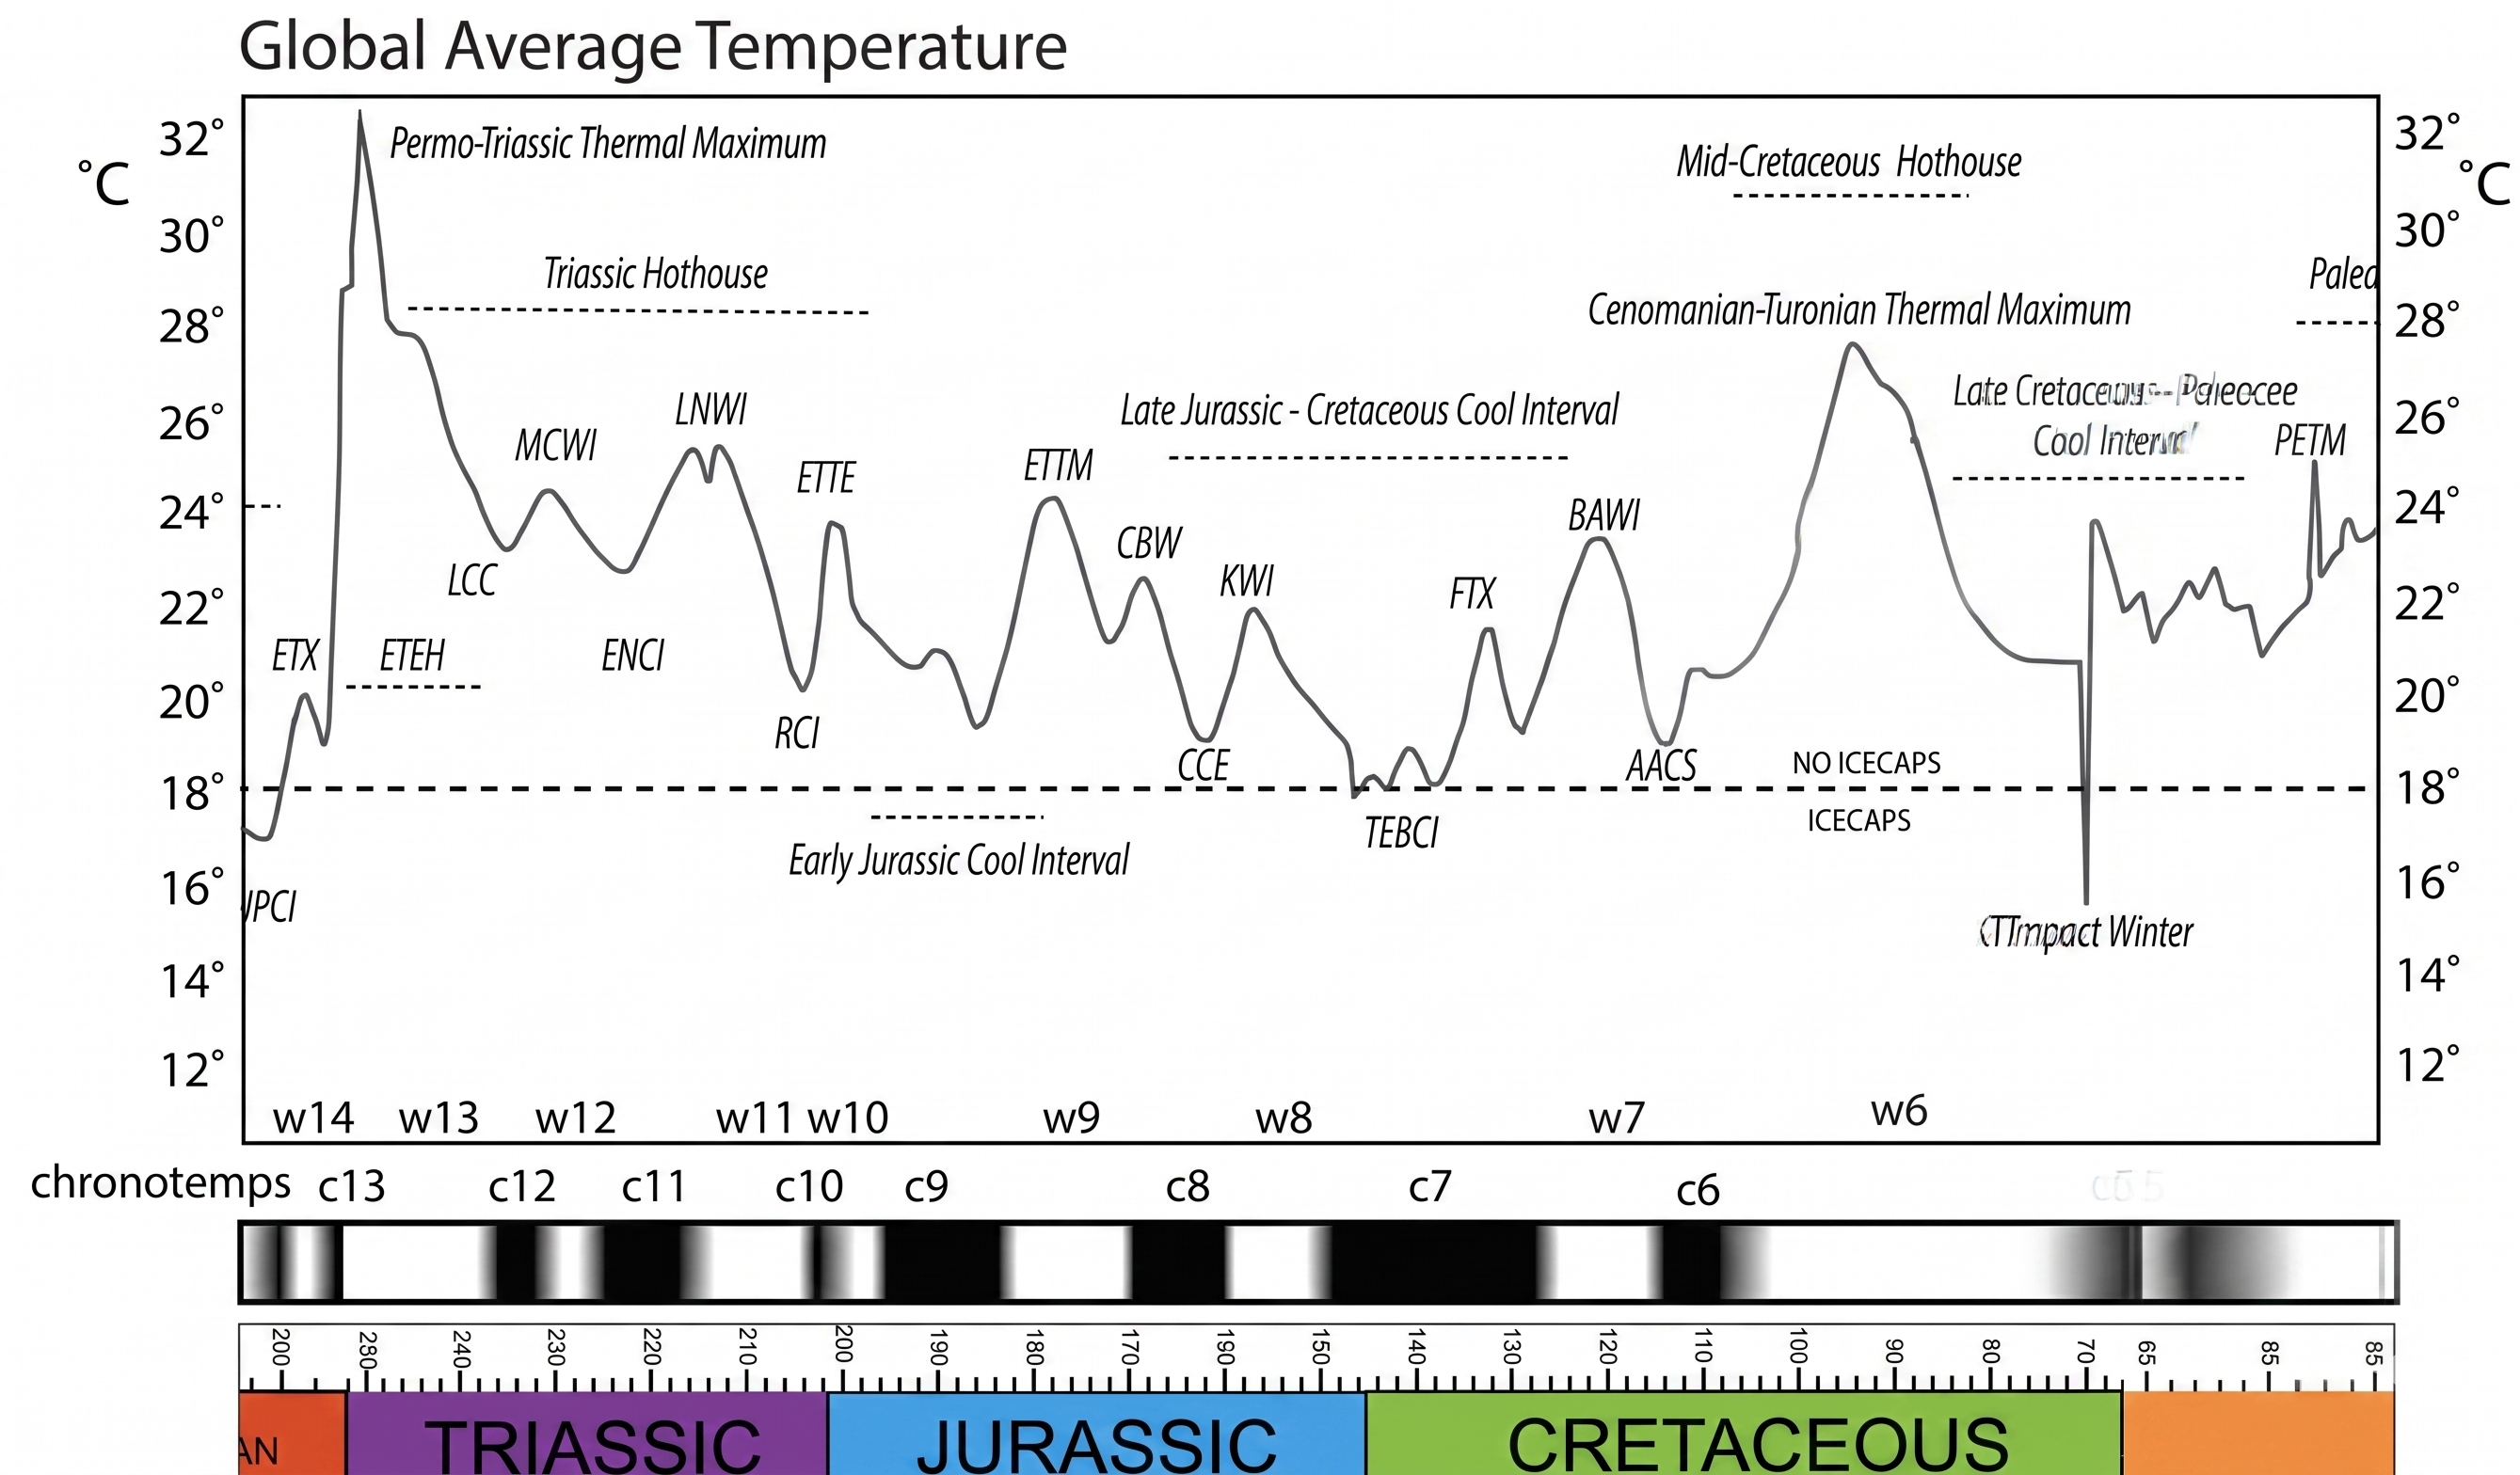
Image 1 · Mesozoic temperature and CO2 curve
Image 1. Global mean temperature and CO2 across the Mesozoic, reconstructed by data assimilation in PhanDA. The curve shows three clear patterns: Triassic with variable temperatures (19 to 28°C), mid-Jurassic with a cooler window (minimum of 17°C in the Bathonian), and Cretaceous with progressive warming up to the Turonian peak (~91 Ma, 35°C). CO2 never fell below ~600 ppm, more than 40% above the current concentration (~420 ppm). Data: Judd et al. 2024, Science, via the public PhanDA repository (CC BY).
Table 1 · Today's climate vs. Mesozoic
Known polar dinosaurs
Glacialisaurus hammeri
Antarctica, ~190 Ma. Herbivorous sauropodomorph found in the same formation as Cryolophosaurus.
Leaellynasaura amicagraphica
Australia, ~105 Ma. The continent sat at the south pole during the Cretaceous. Large eyes, possibly adapted to polar darkness.
Image 2 · The Mesozoic in four snapshots
Triassic · 252 to 201 Ma
Pangaea united, extreme aridity, and the dawn of the dinosaurs
The Triassic begins 252 million years ago, just after the largest mass extinction in Earth's history (end of the Permian). All continents were fused into a single supercontinent, Pangaea, stretching from the north pole to the south pole. The interior of this supercontinent sat thousands of kilometers from any ocean and was therefore extremely arid.
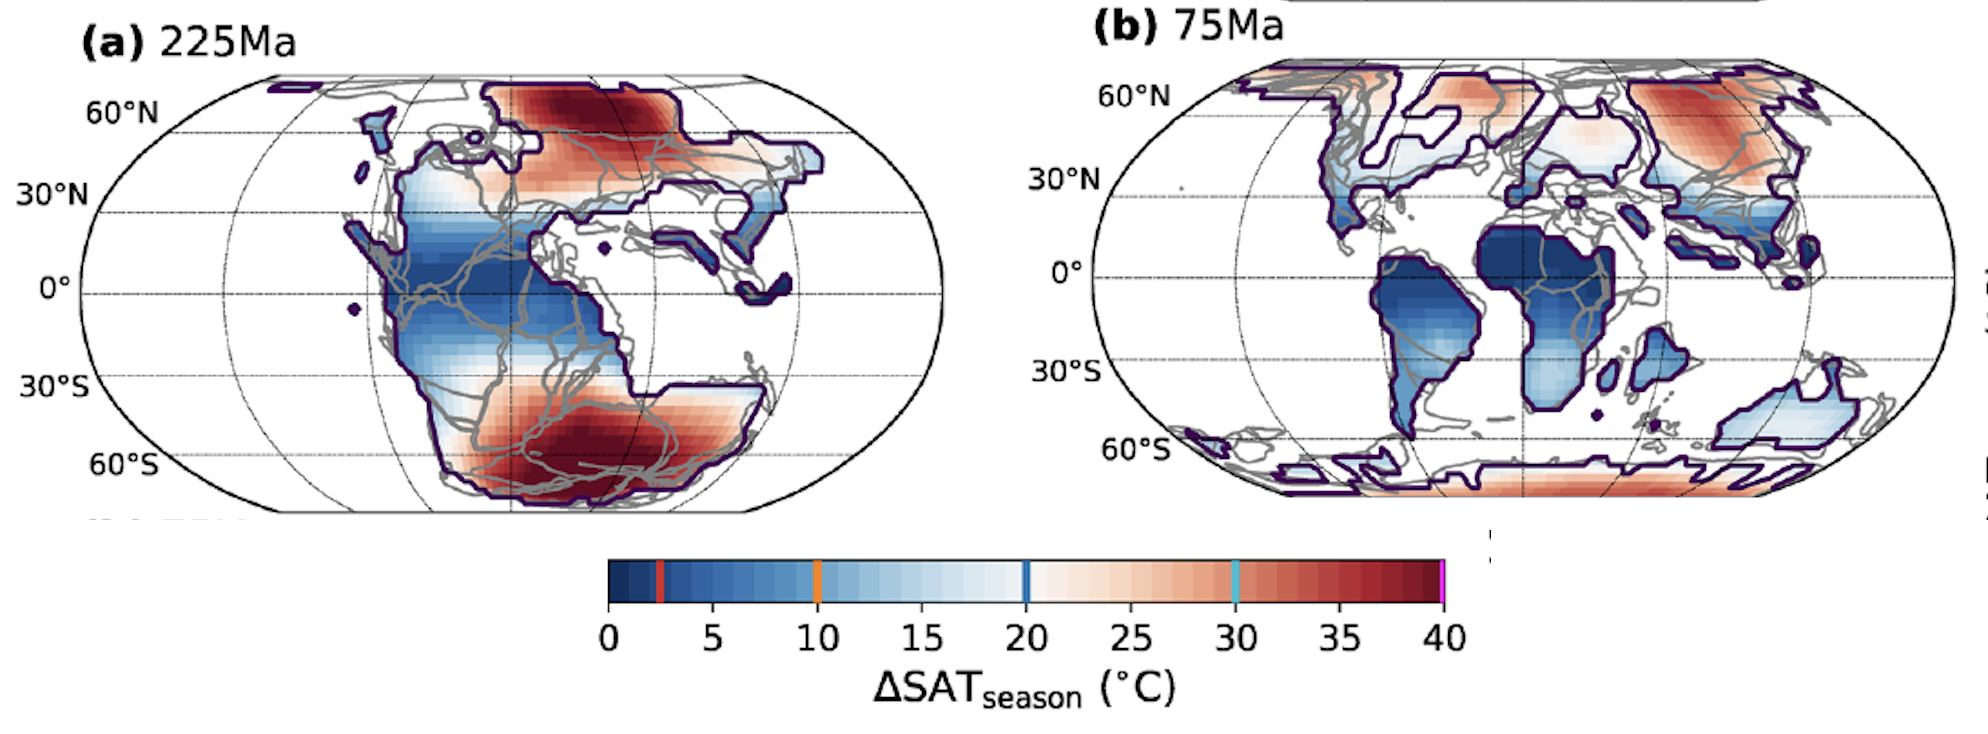
According to the climate model of Landwehrs et al. (2021), published in Paleoceanography and Paleoclimatology, continental seasonality in the late Triassic reached ~22°C of difference between summer and winter, almost double what would be seen in the Cretaceous. The arid zones covered most of Pangaea, while the poles had a temperate climate without permanent ice.
The end of the Triassic was marked by a dramatic event: the eruption of the Central Atlantic Magmatic Province (CAMP), one of the largest volcanic provinces ever recorded. Shen et al. (2022), in a Nature Communications study, reconstructed this episode from geochemical profiles and numerical simulations. CAMP volcanism released isotopically light carbon into the atmosphere, raising CO2 from ~2,000 ppm to estimated peaks between 4,000 and 5,000 ppm in less than 500,000 years. The system took between 1 and 3 million years to return to pre-eruption levels, via silicate weathering.
This event killed 40% to 50% of marine species and completely restructured terrestrial ecosystems. On the winning side, dinosaurs, which had emerged in the mid-Triassic but lived restricted to smaller niches, inherited the planet. Their Jurassic radiation is a direct consequence of that climate reset.
Jurassic · 201 to 145 Ma
Pangaea breaks apart, wet climate expands, dinosaurs reach the poles
The Jurassic inherits a more fragmented world. Pangaea begins to split along major rifts, the future Atlantic opens between Africa and North America, and new shallow oceans cover areas that used to be desert. The climate result was a gradual drop in continental aridity and a wetter average climate.
The Landwehrs et al. (2021) model, which simulated the Mesozoic climate in 40 time slices of 5 million years each, identifies a clear trend in the Jurassic: continental seasonality drops from ~22°C to ~15°C between the late Triassic and the late Cretaceous, driven precisely by this fragmentation of Pangaea. More ocean, less dry continental interior.
The PhanDA curve from Judd et al. (2024) shows that the Jurassic was, on average, the coolest period of the Mesozoic, with a minimum of 17°C in the Bathonian (~166 Ma), about 2°C above today's global mean. But even that "cool" window was still an ice-free planet: the poles had temperate forests, and that was the very setting where Cryolophosaurus lived in Antarctica, ~190 Ma, alongside the herbivorous sauropodomorph Glacialisaurus hammeri.
What made Jurassic Antarctica habitable was not a tropical temperature, but a combination of three factors: CO2 between 700 and 1,100 ppm sustaining an intense greenhouse effect, the absence of polar albedo (no ice to reflect sunlight), and continental connection to South America and Australia via Gondwana. The real challenge of living at high latitudes was not the cold; it was the months of darkness during polar winter.
Cretaceous · 145 to 66 Ma
The maximum greenhouse and the Turonian thermal peak
The Cretaceous is the warmest period of the Mesozoic and one of the most extreme climates ever reconstructed. The PhanDA curve from Judd et al. (2024) records a peak of 35°C global mean temperature in the Turonian (~91 Ma), more than double today's average of ~15°C. This interval became known as the "supergreenhouse," when tropical oceans surpassed 35°C and Antarctica had temperate forests near the coast.
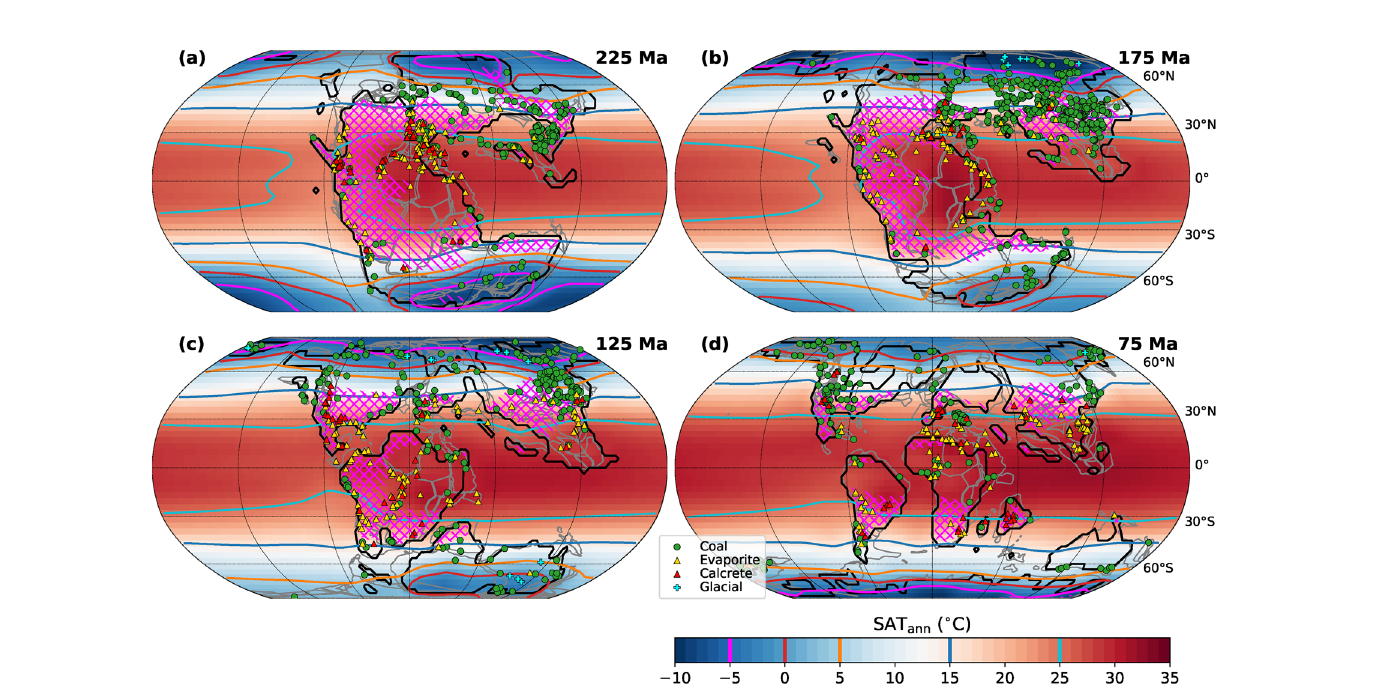
But the period was not uniformly warm. Hay and Floegel (2012), in a review published in Earth-Science Reviews, reconstructed six time slices of the Cretaceous from the climate proxy database of Chumakov et al. (1995), which maps global climate belts based on the worldwide distribution of coals, evaporites, bauxites, limestones, glacial dropstones, and indicator fossils. The six slices below document the transition between an early Cretaceous still relatively cool, the mid-Cretaceous thermal peak, and the final cooling toward the K-Pg extinction.
Image 4 · The six climate slices of the Cretaceous
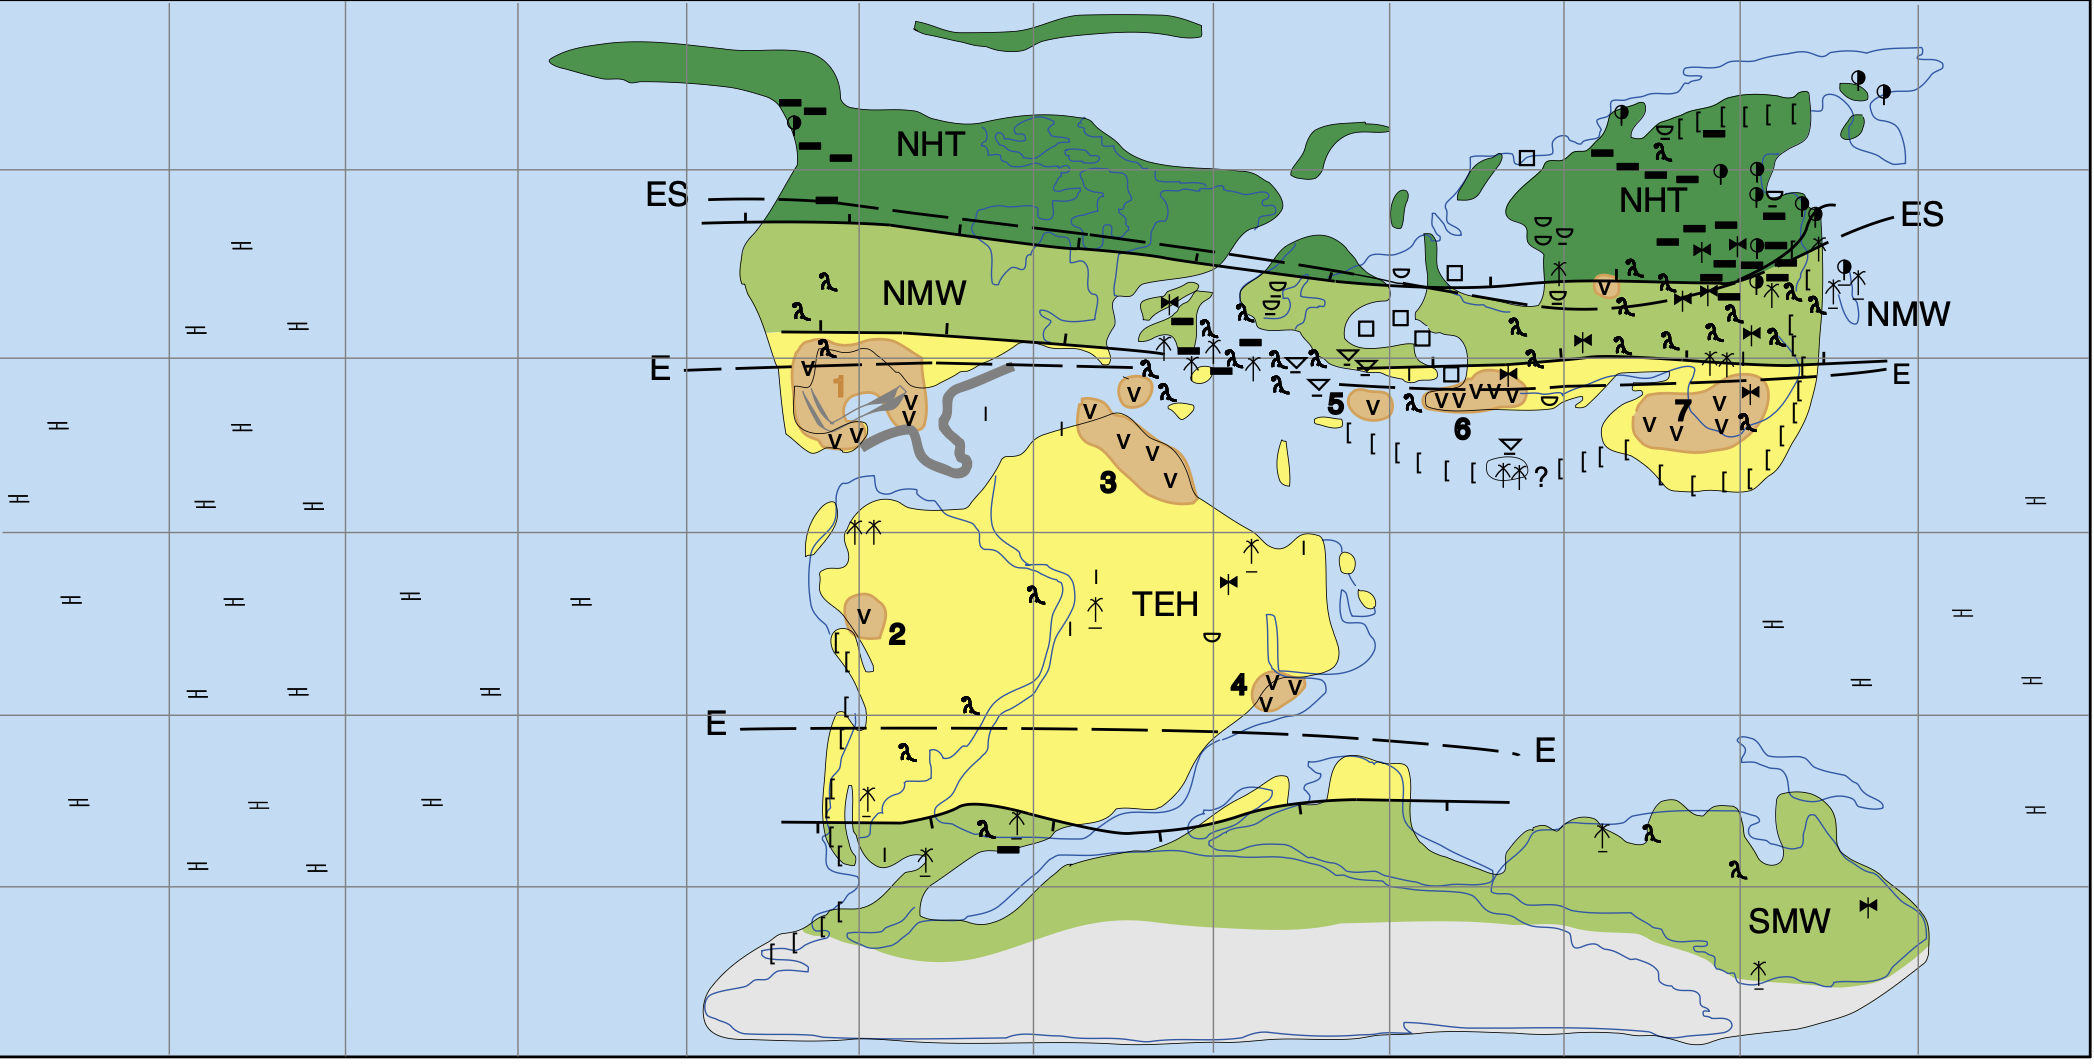
How to read the maps · Chumakov climate belts
The letters on the maps mark the climate belts; this legend applies to every slice in the carousel above. Acronyms: N/S = Northern/Southern, H/M = High/Mid, T/W = Temperate/Warm, A = Arid, E = Equatorial, H = Humid.
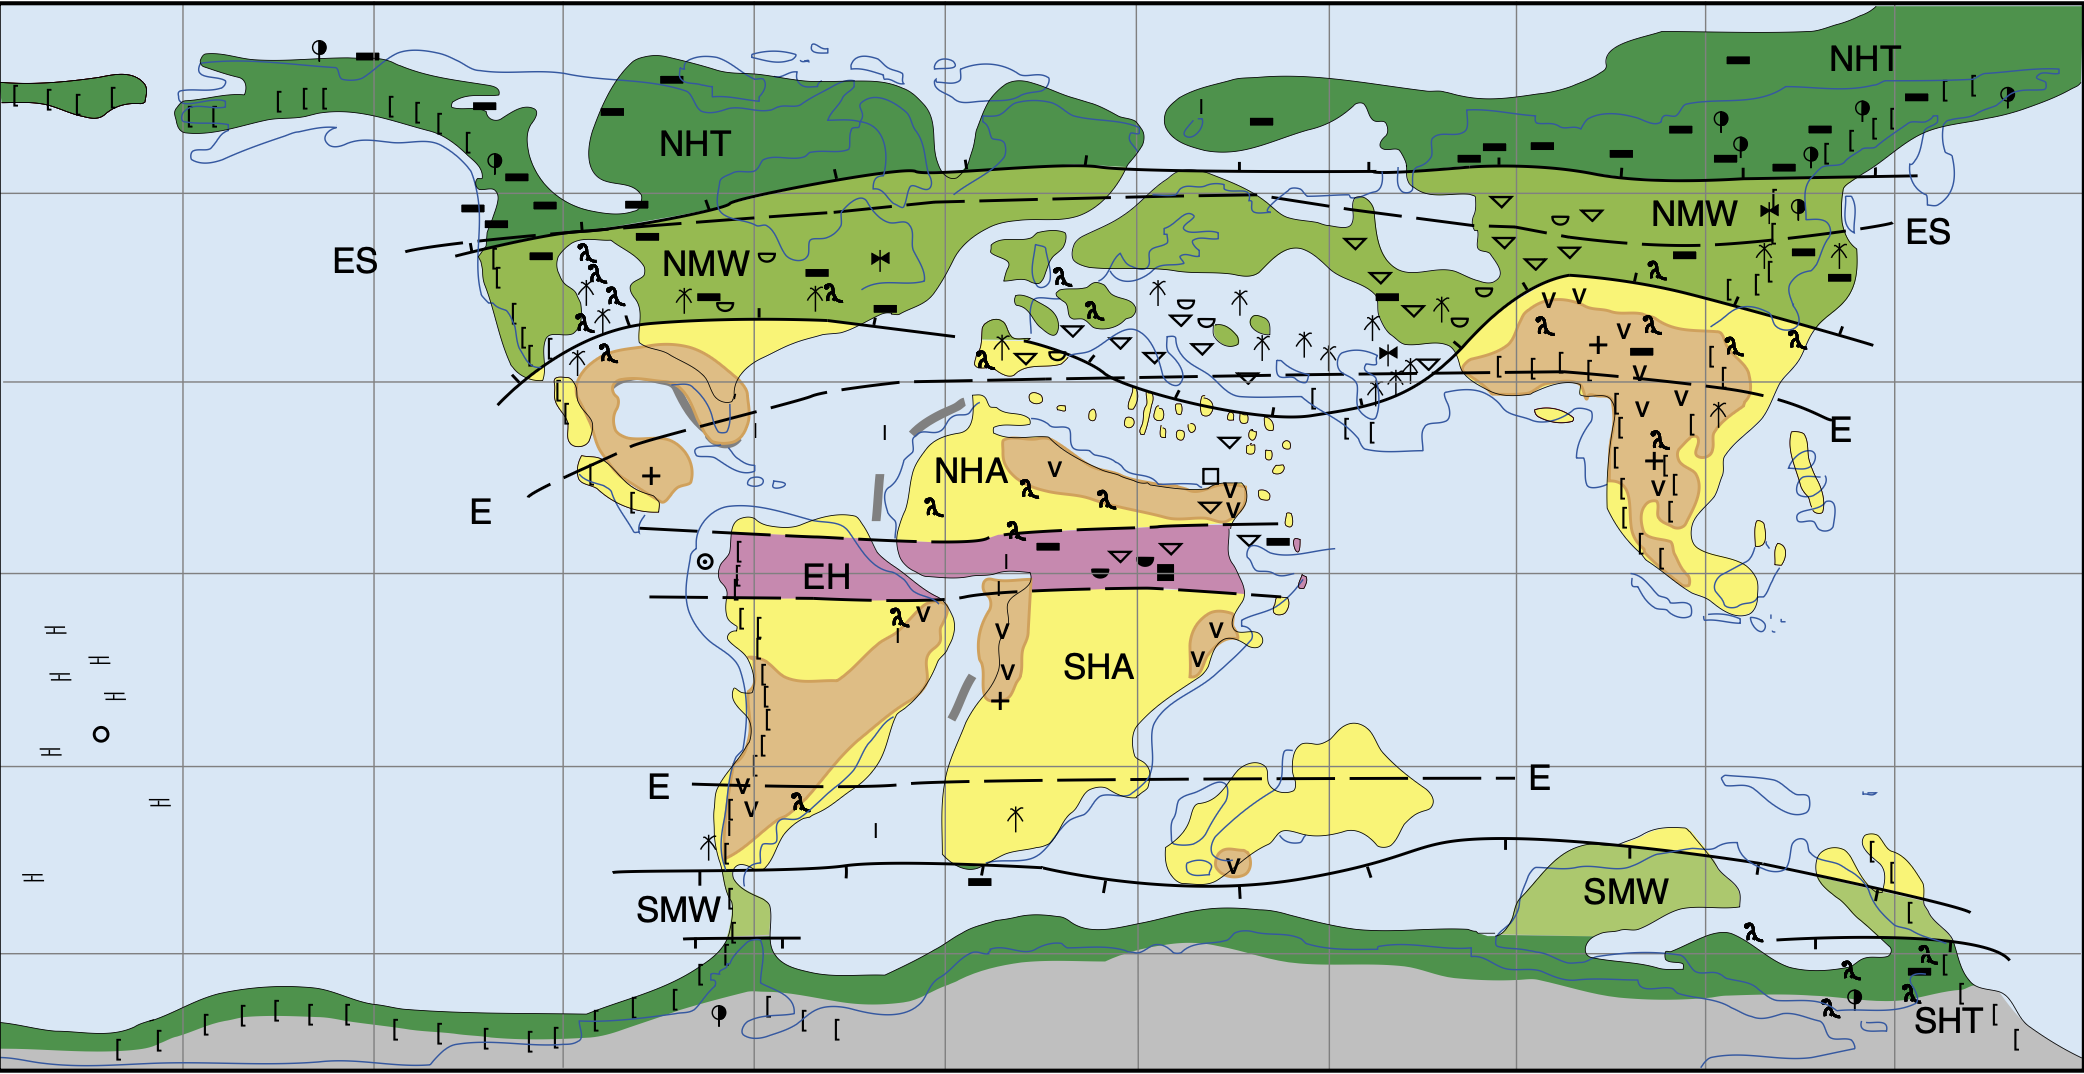
Berriasian · ~145 to 140 Ma
The Berriasian opens the Cretaceous already in a climatically moderate regime by Mesozoic standards. The PhanDA curve places the global mean temperature around 23 to 25°C, well below the Turonian peak. Glacial dropstone data from the late Jurassic and basal Cretaceous (Frakes and Francis 1988; Price 1999) point to seasonal sea ice at high latitudes in both hemispheres, although without thick continental ice sheets. Atmospheric CO2 oscillated between 600 and 1,100 ppm, an intermediate range for the period.
On the Hay and Floegel (2012) map, the Tethys is the dominant climatic feature: a wide equatorial ocean separating Laurasia to the north and Gondwana to the south, with an extensive equatorial humid belt (EH) over Africa and South America. The South Atlantic does not yet exist as an open ocean. The northern hemisphere continents already display a wide temperate belt (NHT), indicating that the cryosphere did not yet dominate, even with lower temperatures than the Cretaceous peak ahead.
Highlight
The Cretaceous starts already warm by today's standards, but cool by the Mesozoic standards to come. Wide temperate belts at both poles; no sign yet of a tropical hot humid zone.
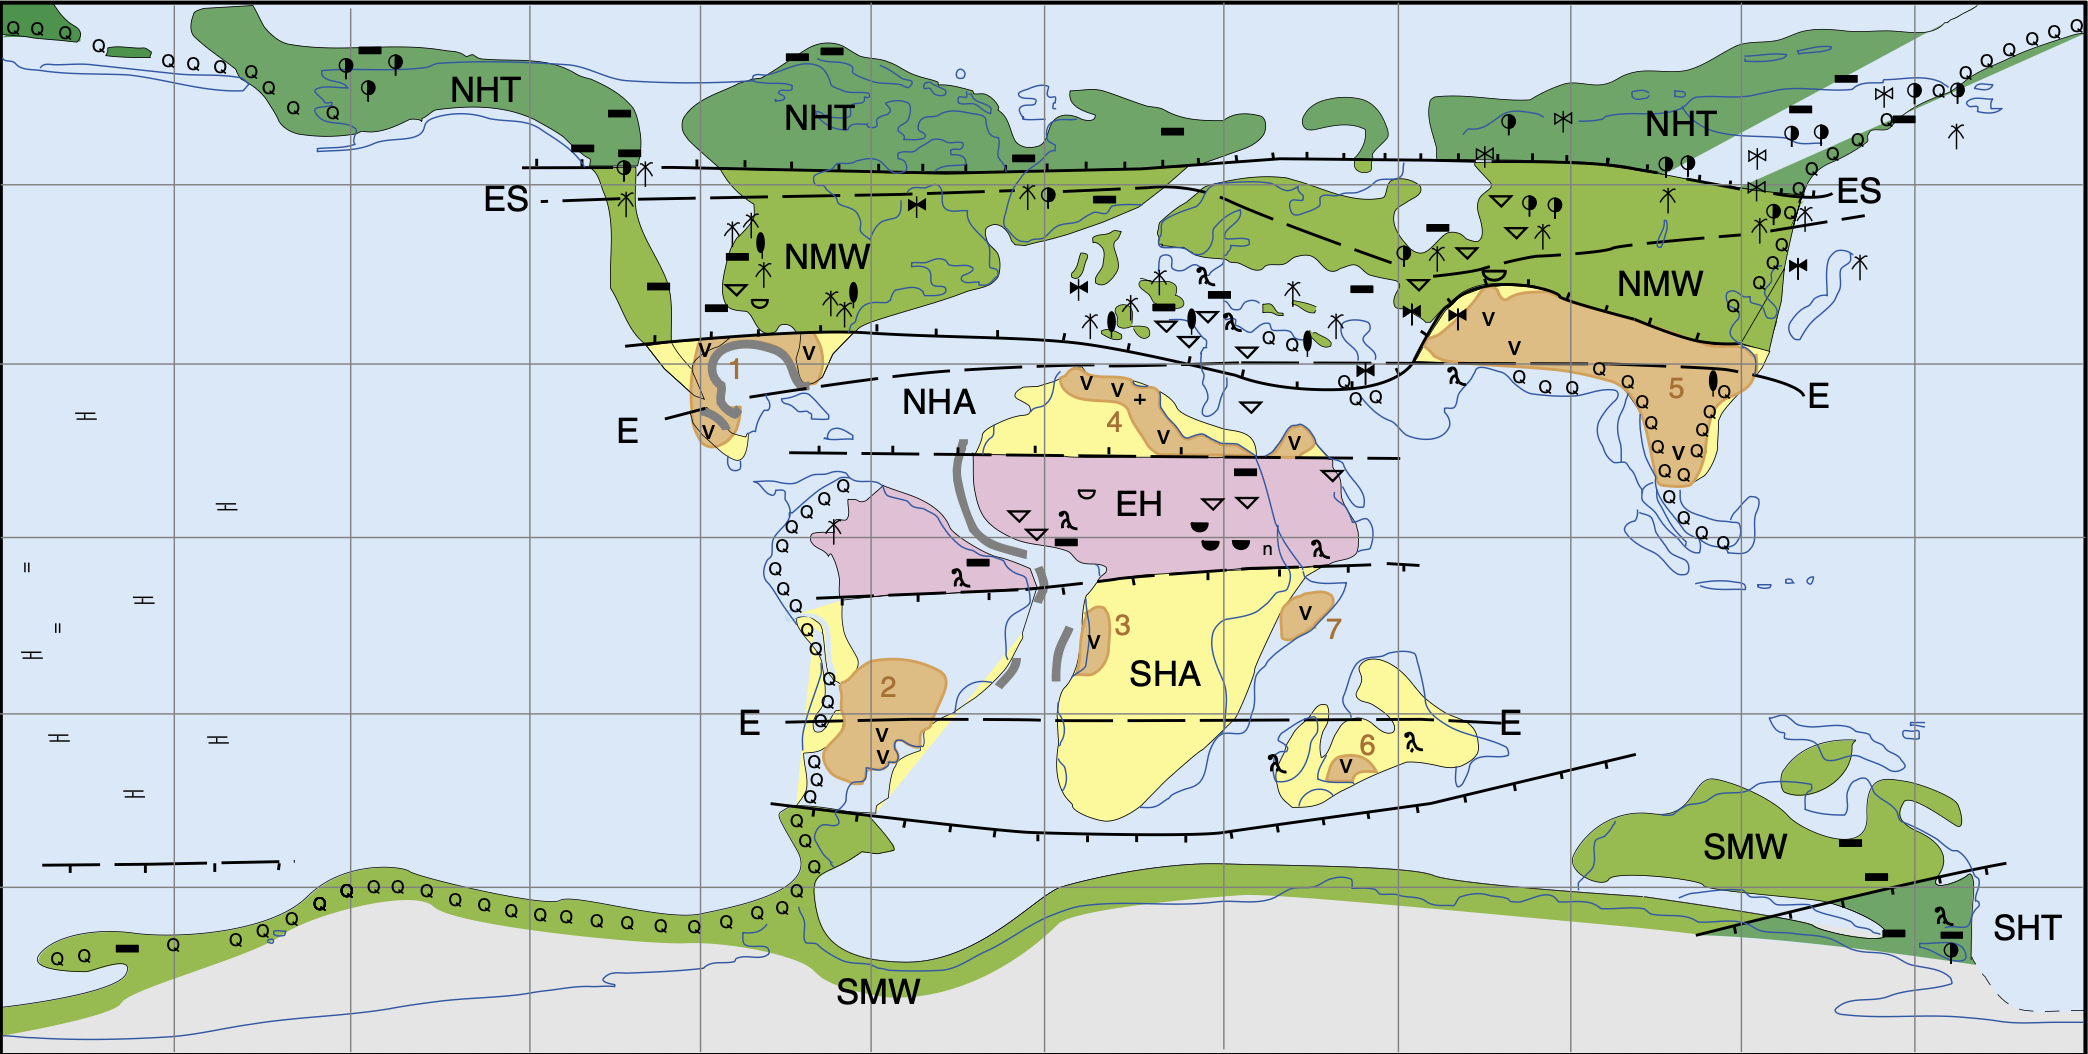
Aptian · ~121 to 113 Ma
The Aptian marks the Cretaceous turn toward an extreme greenhouse regime. Oceanic Anoxic Event 1a (OAE1a, the Selli Event, ~120 Ma) is the most dramatic signal: a global episode of black shale deposition rich in organic matter, paired with a negative carbon isotopic shift indicating a massive volcanic CO2 injection into the atmosphere. The origin was the formation of the Ontong-Java oceanic plateau in the Pacific, one of the largest large igneous provinces in Earth's history (Larson 1991; Tejada et al. 2009). Tropical sea surface temperatures rise to 30 to 33°C and CO2 reached estimated peaks between 1,500 and 2,000 ppm.
On the Hay and Floegel map, the southern hemisphere hot arid belt (SHA) begins to expand over what is today the interior of Africa and South America, a consequence of the latitudinal drift of these continents away from the equator as Gondwana fragments. The South Atlantic is still a narrow rift, accumulating thick evaporites (Brazil's pre-salt salt deposits date from this interval). The TEH remains equatorial, but is now narrower, compressed between the advancing arid zones.
What changed since the Berriasian
The arid belts (SHA, NHA) begin to expand and push the temperate belts toward higher latitudes. The South Atlantic opens as a narrow rift and accumulates evaporites (Brazilian pre-salt). The tropical hot humid zone (pink) appears for the first time over equatorial Africa.
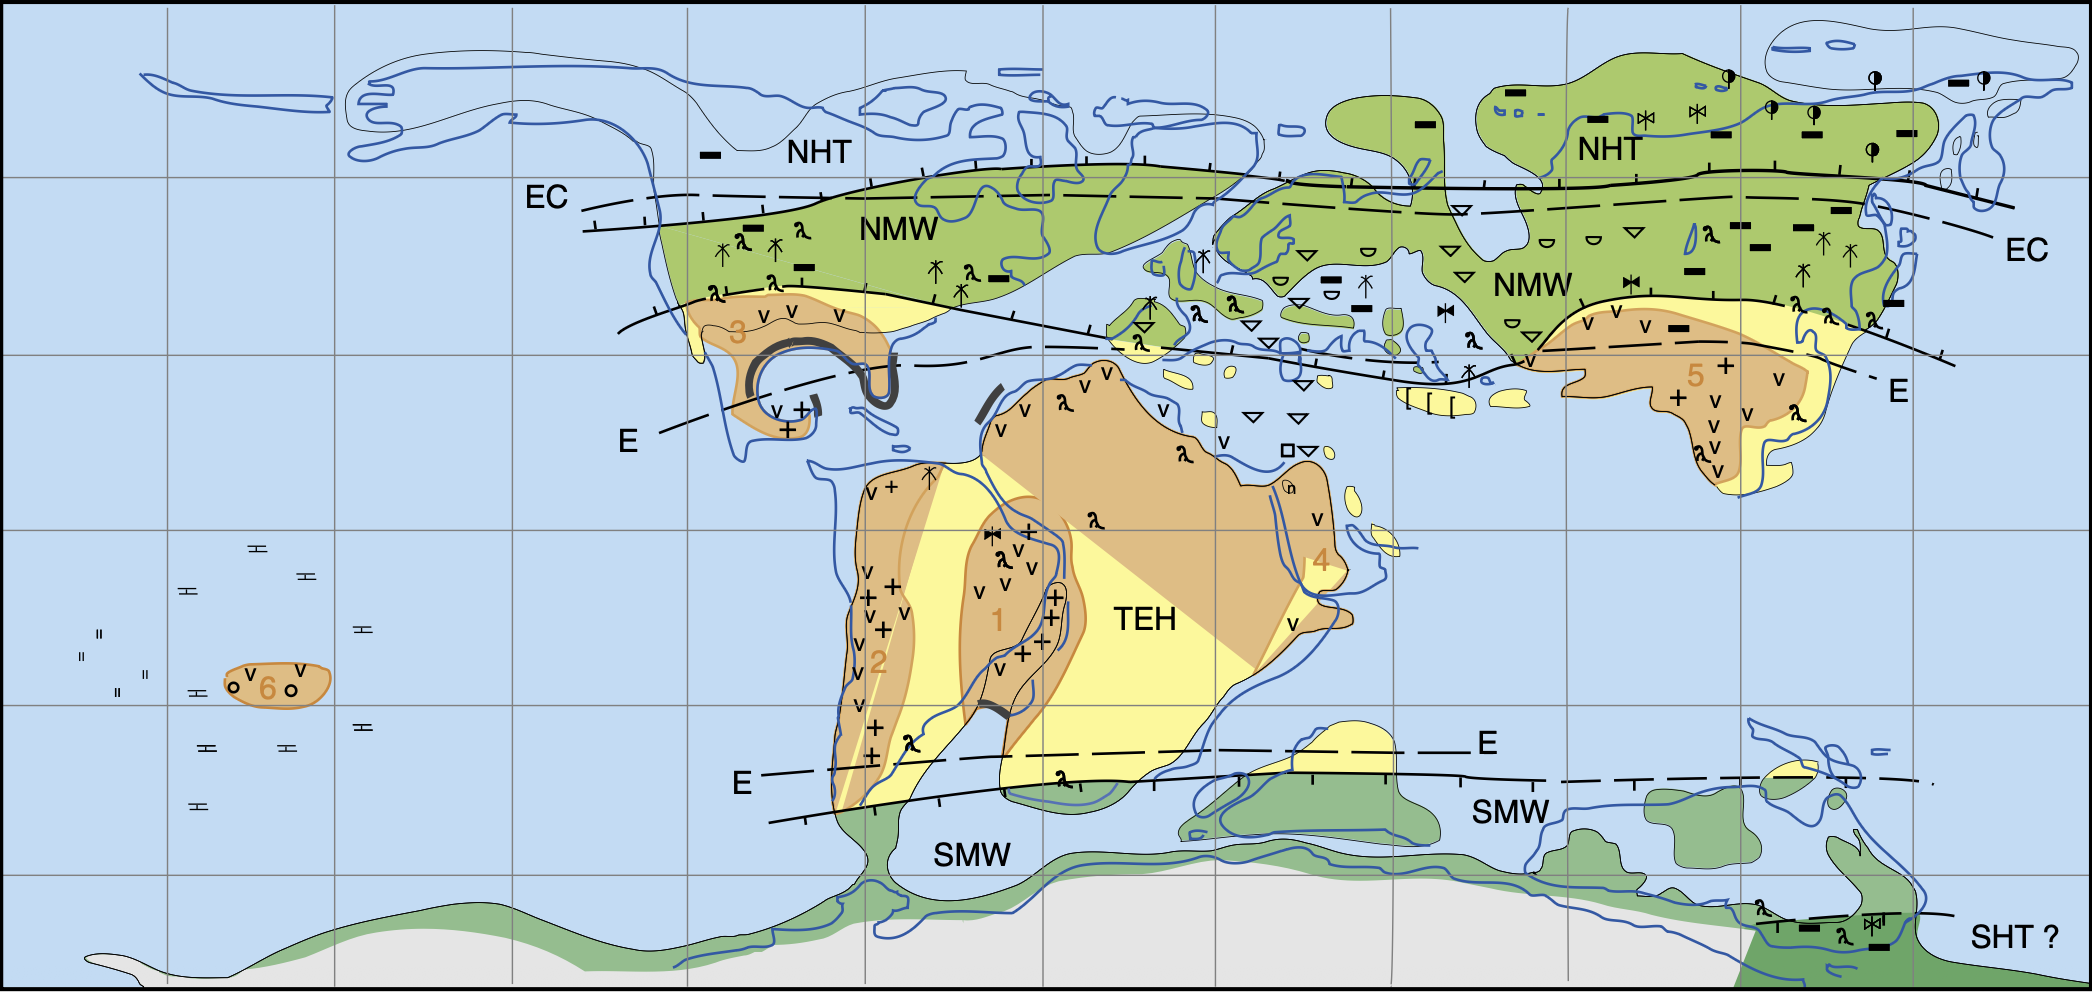
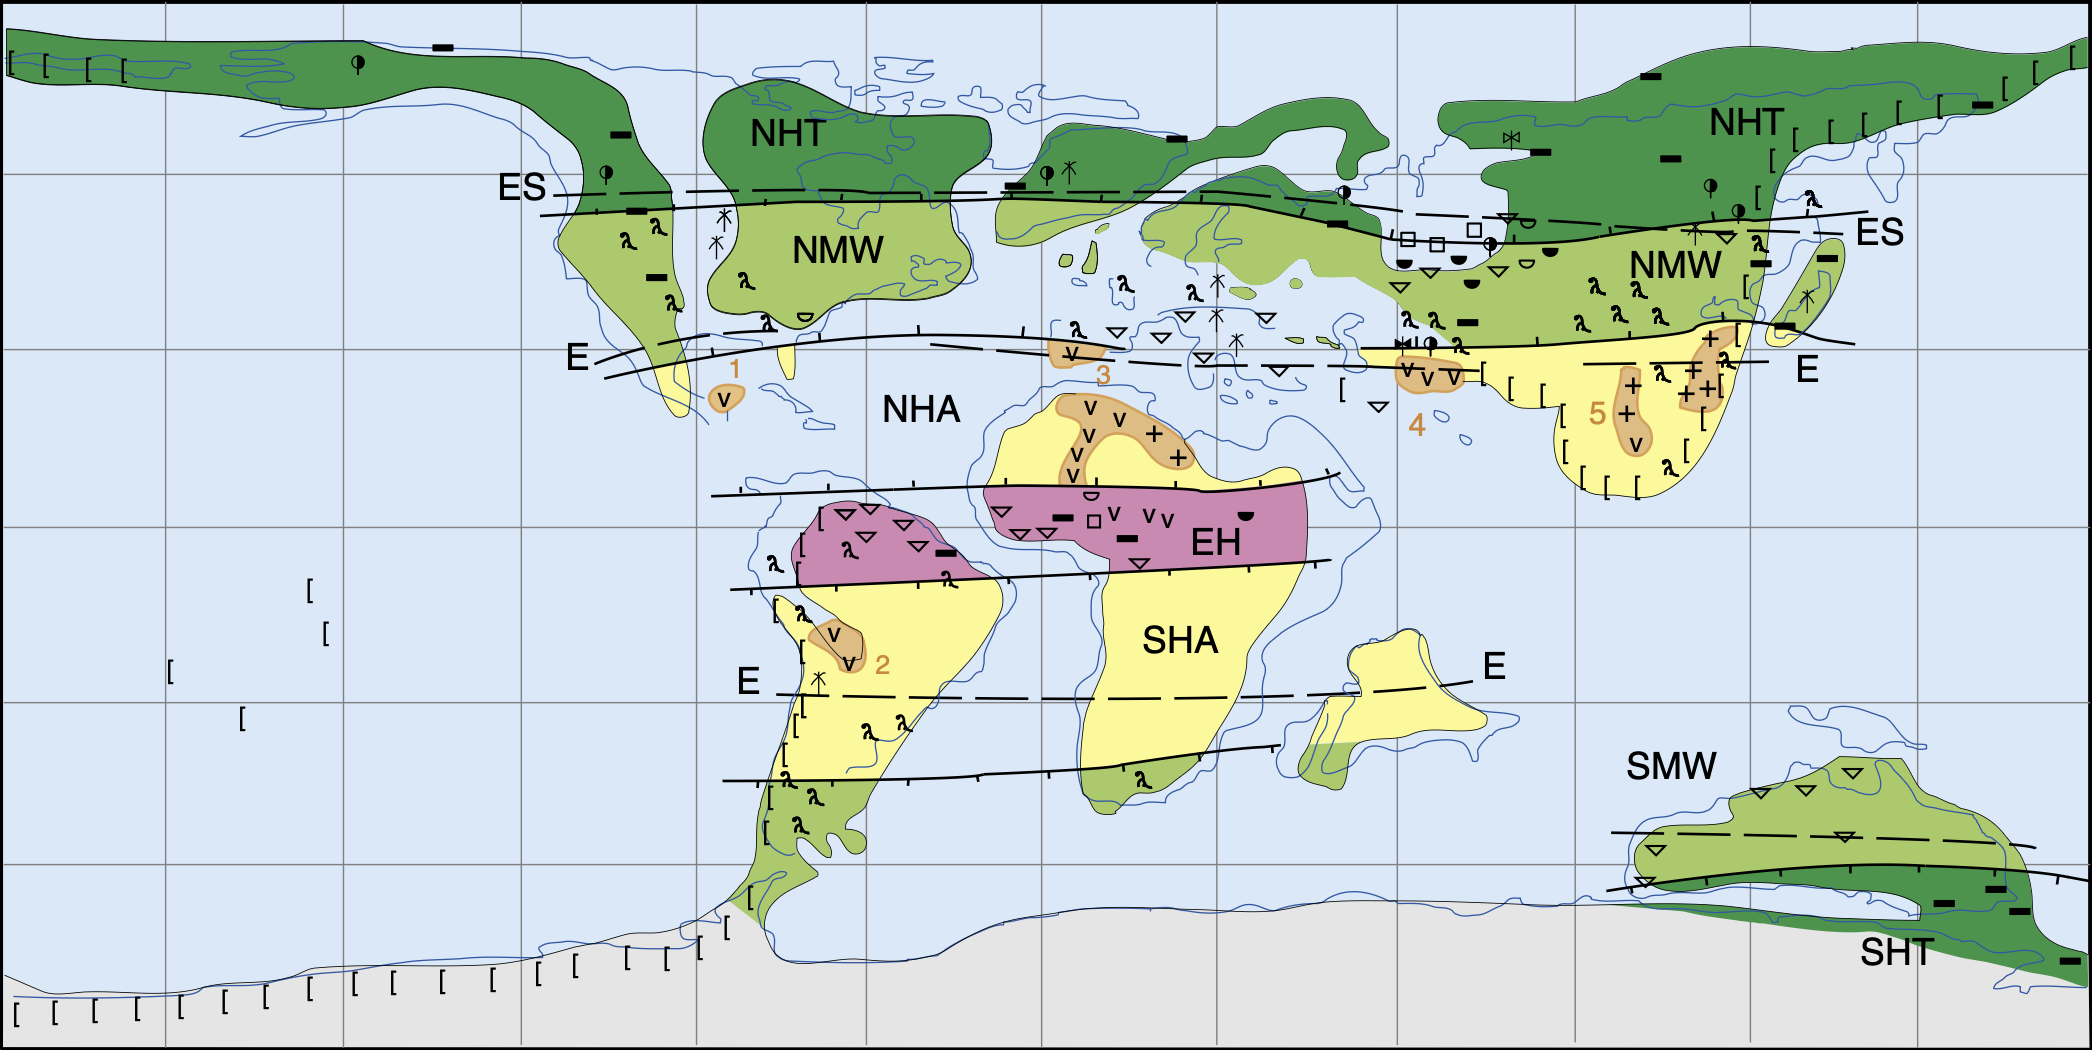
Albian · ~113 to 100.5 Ma
The Albian is the longest stage of the Cretaceous and one of the warmest of the entire Mesozoic. Tropical marine temperatures consistently exceed 32°C (Huber et al. 2002; Norris et al. 2002), and polar deep ocean waters sit near 15°C, against roughly 2°C today. Hay and Floegel (2012) argue that during the tropical Albian, daytime continental temperatures exceeded 42°C for long periods, which would inhibit Rubisco activity (the key photosynthesis enzyme), limiting primary productivity across much of the equatorial belt.
It is during this very interval that Leaellynasaura amicagraphica lived in southern Australia (~105 Ma), then fused with Antarctica at a paleogeographic latitude near 75°S. The planet without a permanent ice cap, with its equator-to-pole gradient reduced to ~17°C, allowed dense temperate forests at high latitudes, even with months of polar darkness. The map shows the equatorial EH belt even more compressed, with a large arid NMW zone over north-equatorial Africa and central Asia, and the northern hemisphere NHT belt displaced to higher latitudes than today.
What changed since the Aptian
The tropical hot zone (pink) consolidates and appears over South America. The arid belts reach their maximum Cretaceous extent. The northern NHT is pushed to very high latitudes. This is the setting of the Australian polar dinosaurs (Leaellynasaura) at paleolatitude ~75°S.
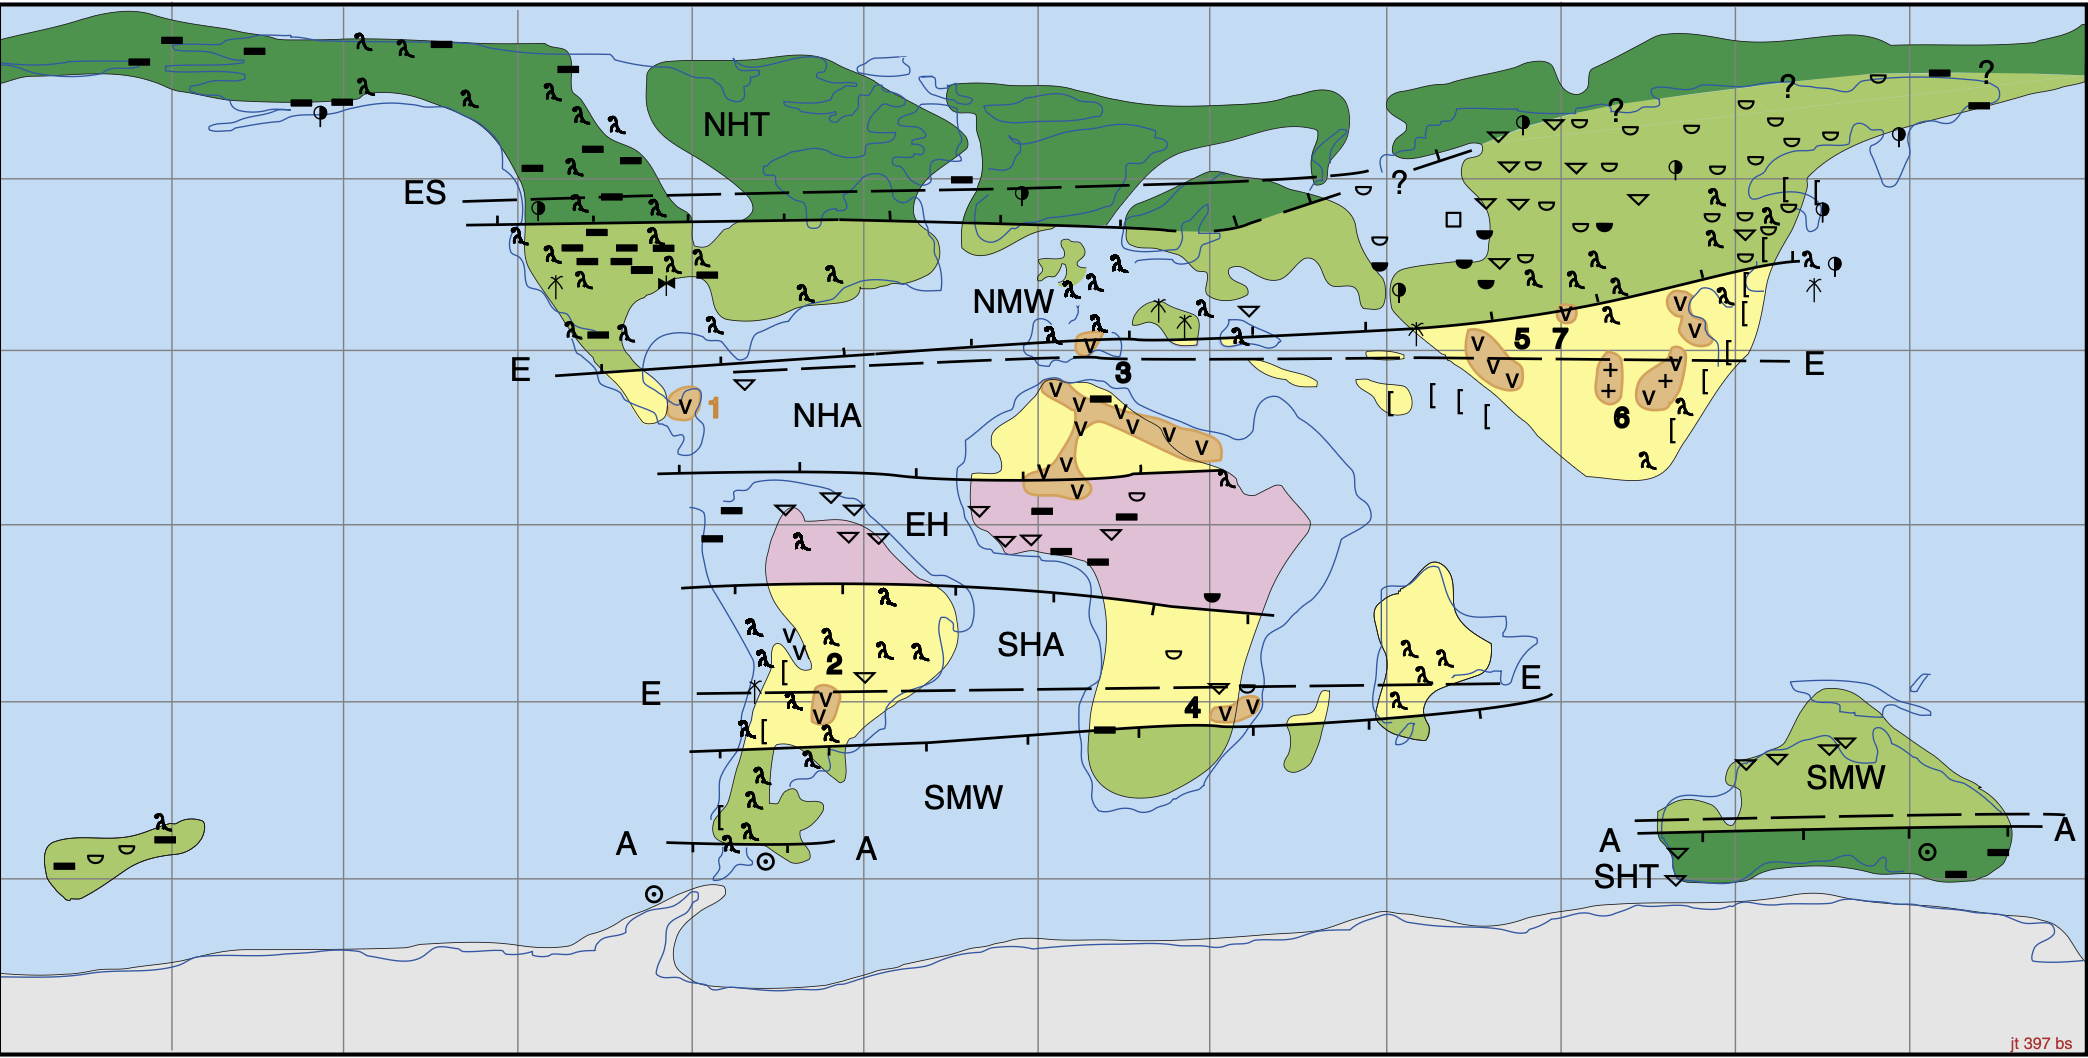
Cenomanian · ~100.5 to 93.9 Ma
The Cenomanian is the stage that leads to the Cretaceous thermal peak. The Cenomanian-Turonian transition (~94 Ma) coincides with Oceanic Anoxic Event 2 (OAE2, the Bonarelli Event), when about 30% of organic carbon worldwide was buried in marine sediments in less than 500,000 years (Schlanger and Jenkyns 1976; Jenkyns 2010). Sea surface temperatures in tropical waters reach 36°C at the peak, according to TEX86 isotope data in African and South American sediments (Forster et al. 2007; Bice et al. 2006). Eustatic sea level is roughly 200 meters above today's, flooding much of North America with the Western Interior Seaway.
On the Hay and Floegel map (Fig. 5 of the paper), the equatorial hot belt (EH) almost disappears, replaced by a wide tropical zone (pink/rose in the original paper) that Hay interprets as a regime where daytime temperatures were so high that Rubisco inhibition would have suppressed photosynthesis in C3 plants. The SHA belt expands further over Africa, and the temperate zones (NHT, SHT) retract toward the poles. The South Atlantic is already an open ocean connected to the Central Atlantic, allowing meridional circulation that transports heat from equator to poles.
What changed since the Albian
The equatorial humid zone (EH) almost disappears, replaced by the tropical hot humid zone (pink). Hay and Floegel interpret this as a sign of daytime temperatures >42°C suppressing C3 photosynthesis. Direct setup for OAE2 and the Turonian peak just ahead.
Santonian · ~86.3 to 83.6 Ma
The Santonian marks the start of the descent toward the final Cretaceous cooling. The Turonian thermal peak (~91 Ma) is behind, and tropical ocean temperatures begin to fall, going from 36°C in the Cenomanian-Turonian to about 30 to 32°C in the Santonian (Huber et al. 2018). Atmospheric CO2 also declines, dropping out of the 1,500 to 2,000 ppm range to between 800 and 1,200 ppm. This gradual cooling appears to have been driven by a combination of increased silicate weathering (more continents exposed as sea level falls) and reduced large-scale volcanism after the end of the mid-Cretaceous large igneous provinces.
The Hay and Floegel map shows the recovery of the equatorial EH belt (light green), now more continuous between continents. The northern hemisphere NHA arid belt remains strong over North Africa and the Middle East, but the temperate zones NHT and SHT begin to grow slightly, indicating that the equator-to-pole thermal gradient is steepening again. The continents are already in positions very close to today's, and the North Atlantic is already a wide ocean with a connection to the Arctic.
What changed since the Cenomanian
The equatorial humid EH zone returns to occupy the tropical band (pink retreats). The temperate NHT and SHT belts begin to grow again; the equator-to-pole thermal gradient sharpens. Tropical ocean drops from ~36°C to ~30-32°C.
Maastrichtian · ~72 to 66 Ma
The Maastrichtian is the last stage of the Cretaceous and of the Mesozoic. Temperatures keep falling: tropical oceans sit in the 28 to 30°C range and deep oceans reach 10°C, heading toward the cooler planet of the early Cenozoic. Estimated CO2 is ~500 to 800 ppm, still well above today's 420 ppm but the lowest of the Cretaceous. Antarctica develops seasonal sea ice, although without thick caps, and polar dinosaurs such as Edmontosaurus annectens in northern Alaska (Prince Creek Formation, ~69 Ma) had to tolerate winters with temperatures near zero and months of continuous darkness.
On the map, the South Pole shows the first "A" zone (likely Antarctic, according to Hay and Floegel, who interpreted the initial A from Chumakov's original manuscript), indicating a cool continental climate. At the North Pole, the NHT belt is the most extensive since the start of the Cretaceous, covering Alaska, Siberia, northern North America, and Scandinavia at paleogeographic latitudes above 70°N. The Deccan Traps volcanism begins at the end of the stage (~66.25 Ma), injecting CO2 and aerosols in irregular pulses that interact with the Chicxulub impact at 66.043 Ma, ending the era of non-avian dinosaurs.
What changed since the Santonian
For the first time in the Cretaceous, an "A" zone appears over the south pole, climatically Antarctic. The northern NHT covers Alaska, Siberia, and Scandinavia at paleolatitudes >70°N. The atmosphere already sits at ~500-800 ppm CO2, the lowest of the period. This is the setting of Edmontosaurus surviving Arctic-polar winters in Alaska.
The sequence of the six slices shows a Cretaceous with a clear trajectory: progressive warming from the Berriasian to the Turonian, greenhouse peak in the Cenomanian-Turonian, gradual cooling afterward. The southern hemisphere arid belt expands and then retracts as Gondwana fragments, and the temperate polar zones migrate to higher latitudes early in the period and then expand again at its end. Throughout the entire time, however, the planet remained above the threshold for continental glaciation, sustaining forests at both polar circles and a fauna of dinosaurs adapted to high latitudes.
The Mesozoic in the context of 540 million years
Zooming out: the Mesozoic was just one of several climate modes of the Phanerozoic (last 540 million years). The figure below combines two independent datasets: temperature proxies from oxygen isotopes (Prokoph et al. 2008, 6,680 measurements) and atmospheric CO2 proxies compiled by Royer. It shows the connecting thread that ties the Triassic, Jurassic, and Cretaceous to the entire Paleozoic and Cenozoic.
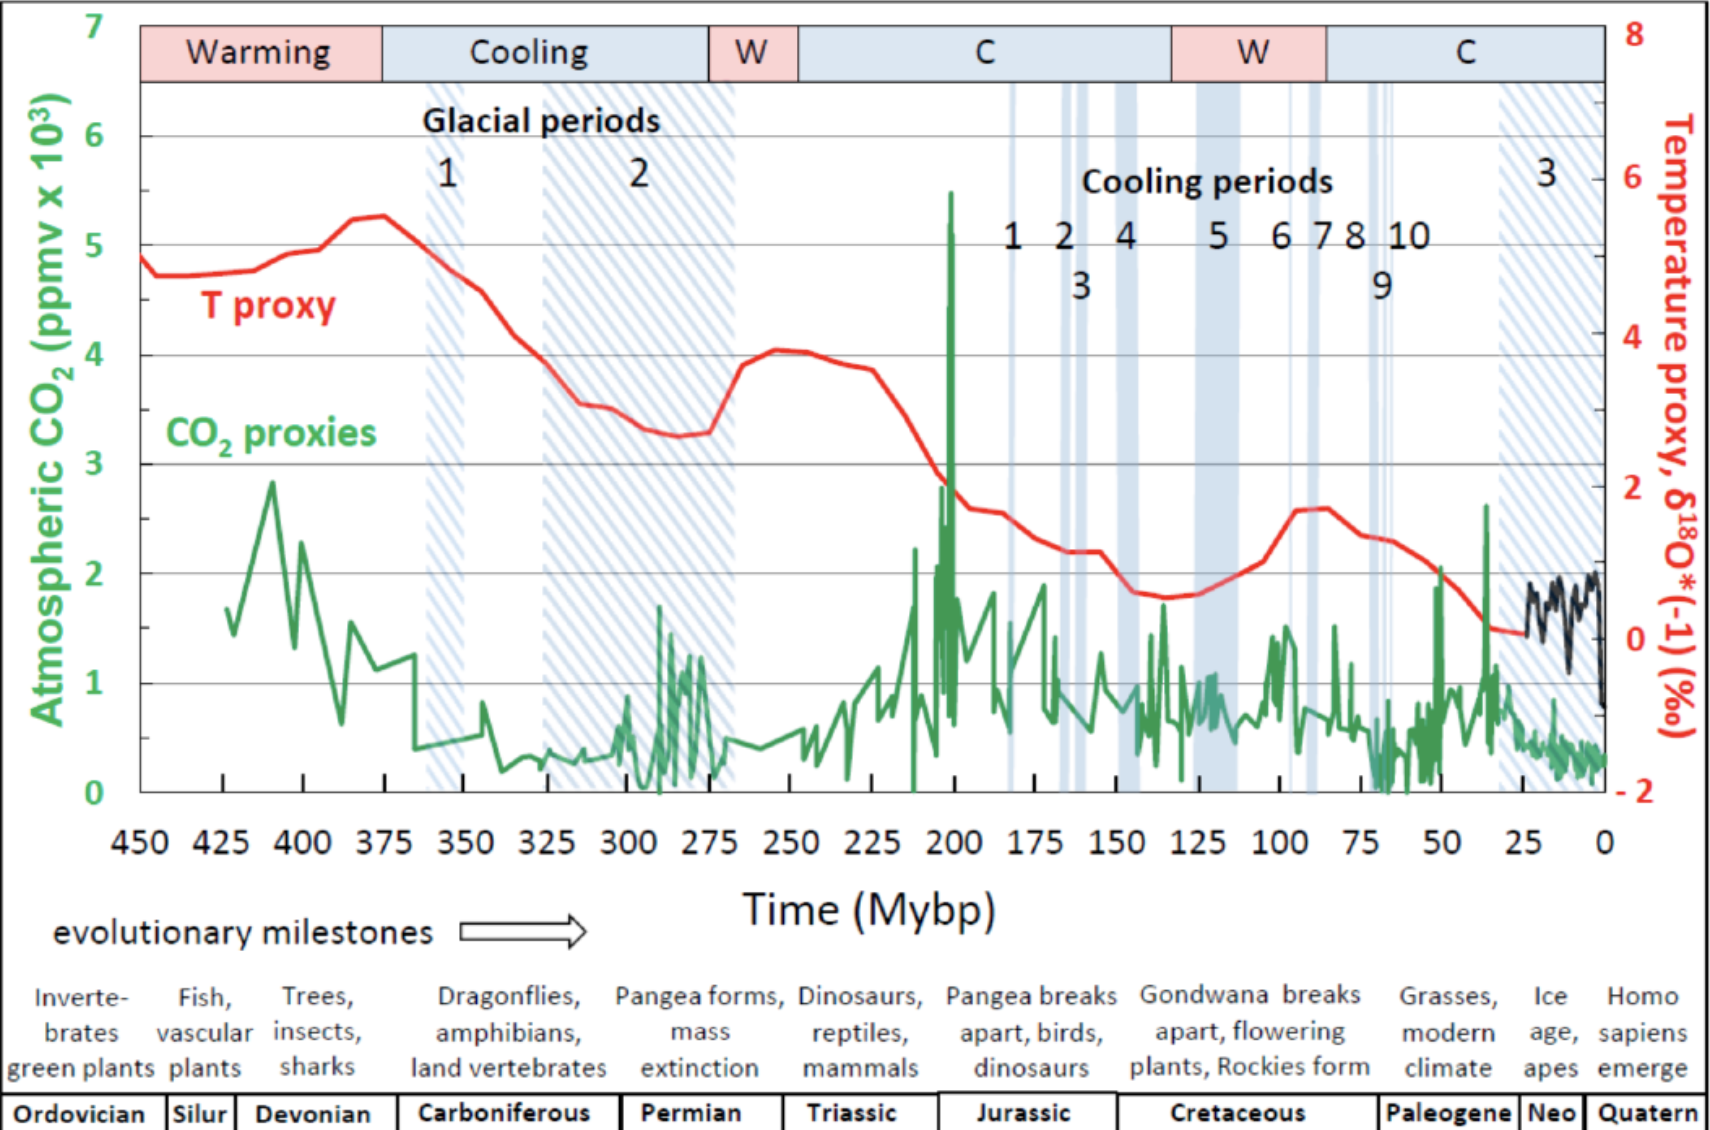
A direct consequence of this greenhouse regime was the dramatic reduction of the equator-to-pole thermal gradient. On today's planet, the difference is about 30°C. In the mid-Cretaceous, it dropped to ~17°C, with summer polar temperatures around 5 to 10°C. That is the thermodynamic reason why dinosaurs could live at high latitudes.
Within the Mesozoic itself, Scotese et al. (2021) divide the history into alternating "hothouse" and "cool interval" stages. The diagram below names the main phases: the Triassic Hothouse, the Early Jurassic Cool Interval, the Late Jurassic-Early Cretaceous Cool Interval, and the Mid-Cretaceous Hothouse with the Cenomanian-Turonian Thermal Maximum.
Why was the Mesozoic so hot?
- CO2 always high. Atmospheric concentration oscillated between ~620 and ~1,265 ppm throughout the Mesozoic, against ~420 ppm today. Constant volcanism (CAMP at the T-J, Kerguelen and Ontong Java in the Cretaceous) supplied the atmosphere faster than weathering could remove it.
- Shallow, warm oceans. Cretaceous sea level was ~200 m above today's, flooding large portions of the continents. More shallow ocean means more evaporation, more water vapor in the atmosphere, and more heat retention. The epicontinental seaway that cut North America in two existed because of that sea level.
- No ice feedback. Today, polar ice caps reflect part of solar radiation back into space (albedo effect), cooling the planet. In the Mesozoic, with no permanent ice, that mechanism did not exist. Any warming was amplified, and the climate system stayed locked in hot mode.
- Pangaea united at the start. In the Triassic, Pangaea formed a single supercontinent, with extreme continental interior and seasonality of more than 40°C between summer and winter. As the oceans opened along the Jurassic and Cretaceous, seasonality dropped, heat transport from the tropics to the poles became more efficient, and the continental climate at high latitudes became more habitable for large land vertebrates.
Back to Cryolophosaurus
With everything together, the opening question has a clear answer. Cryolophosaurus lived in Antarctica 190 million years ago because at that moment the planet was in a greenhouse regime, with atmospheric CO2 between 800 and 1,100 ppm, no permanent polar ice cap, with the pole-to-equator thermal gradient cut in half compared to today, and with the continent still connected to Gondwana via South America and Australia.
The real challenge for it was not the cold, which was tolerable, but the months of darkness during polar winter. Like some migratory birds today, polar dinosaurs probably moved or stockpiled reserves. And when the Mesozoic ended, 66 million years ago, it was mainly because CO2 dropped too quickly, the polar ice feedback began to operate, and non-avian dinosaurs had no way to adapt. The avian ones, what we call birds today, did.
References
- Judd, E. J., Tierney, J. E., Lunt, D. J., Montañez, I. P., Wing, S. L., et al. (2024). A 485-million-year history of Earth's surface temperature. Science, 385(6715). DOI: 10.1126/science.adk3705.
- Scotese, C. R., Song, H., Mills, B. J. W., van der Meer, D. G. (2021). Phanerozoic paleotemperatures: The Earth's changing climate during the last 540 million years. Earth-Science Reviews, 215, 103503. DOI: 10.1016/j.earscirev.2021.103503.
- Landwehrs, J., Feulner, G., Petri, S., Sames, B., Wagreich, M. (2021). Investigating Mesozoic climate trends and sensitivities with a large ensemble of climate model simulations. Paleoceanography and Paleoclimatology, 36. DOI: 10.1029/2020PA004134.
- Shen, J., Yin, R., Zhang, S., Algeo, T. J., Bottjer, D. J., et al. (2022). Intensified continental chemical weathering and carbon-cycle perturbations linked to volcanism during the Triassic–Jurassic transition. Nature Communications, 13, 299. DOI: 10.1038/s41467-022-27965-x.
- Hay, W. W., Floegel, S. (2012). New thoughts about the Cretaceous climate and oceans. Earth-Science Reviews, 115, 262-272. DOI: 10.1016/j.earscirev.2012.09.008.
- Chumakov, N. M., Zharkov, M. A., Herman, A. B., Doludenko, M. P., Kalandadze, N. N., et al. (1995). Climatic belts of the mid-Cretaceous time. Stratigraphy and Geological Correlation, 3(3), 241-260.
- Prokoph, A., Shields, G. A., Veizer, J. (2008). Compilation and time-series analysis of a marine carbonate δ18O, δ13C, 87Sr/86Sr and δ34S database through Earth history. Earth-Science Reviews, 87, 113-133. DOI: 10.1016/j.earscirev.2007.12.003.
- Davis, W. J. (2017). The Relationship between Atmospheric Carbon Dioxide Concentration and Global Temperature for the Last 425 Million Years. Climate, 5(4), 76. DOI: 10.3390/cli5040076. Used only as the source of the combined proxy visualization; the author's interpretation that CO2 and temperature are decoupled is contrary to the paleoclimate consensus and is not adopted here.